
8 dashboards in 12 weeks
The KWbN (Royal Dutch Walking Federation), the leading organisation for the walking community, needed to integrate data-driven decision-making into their business-processes. With a new CRM and a rich digital infrastructure, they have a treasure of information regarding members, profiles and marketing activities.
Together with the KWbN we took on the challenge of gaining actionable insights from these datasets and presenting it so in a clear and straightforward manner. This enables better, data-driven choices on both the strategic and the operational level and in turn helps them to serve their members and hikers in general better.
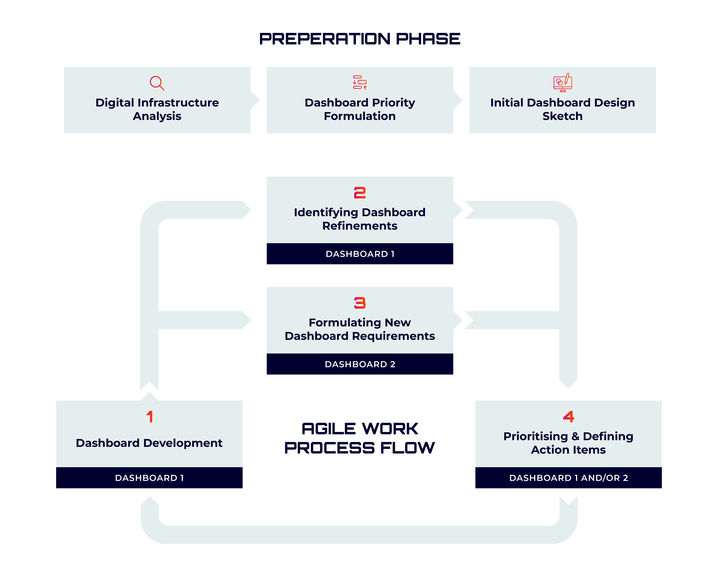
To achieve a quick implementation of the foundational dashboards for marketing, membership and finance, we used a truly agile way of working and clear prioritisation. This allowed us to build the dashboards quickly and rapidly iterate to incorporate improvements and feedback.
This process was enabled by state-of-the-art systems and best-practices like DBT and Fivetran and a wide range of our own data components, in which we heavily invest as Techonomy. In turn, this enables us to work with exceptional efficiency and ensures that we are ready for the future opportunities of new automations and AI utilisation.
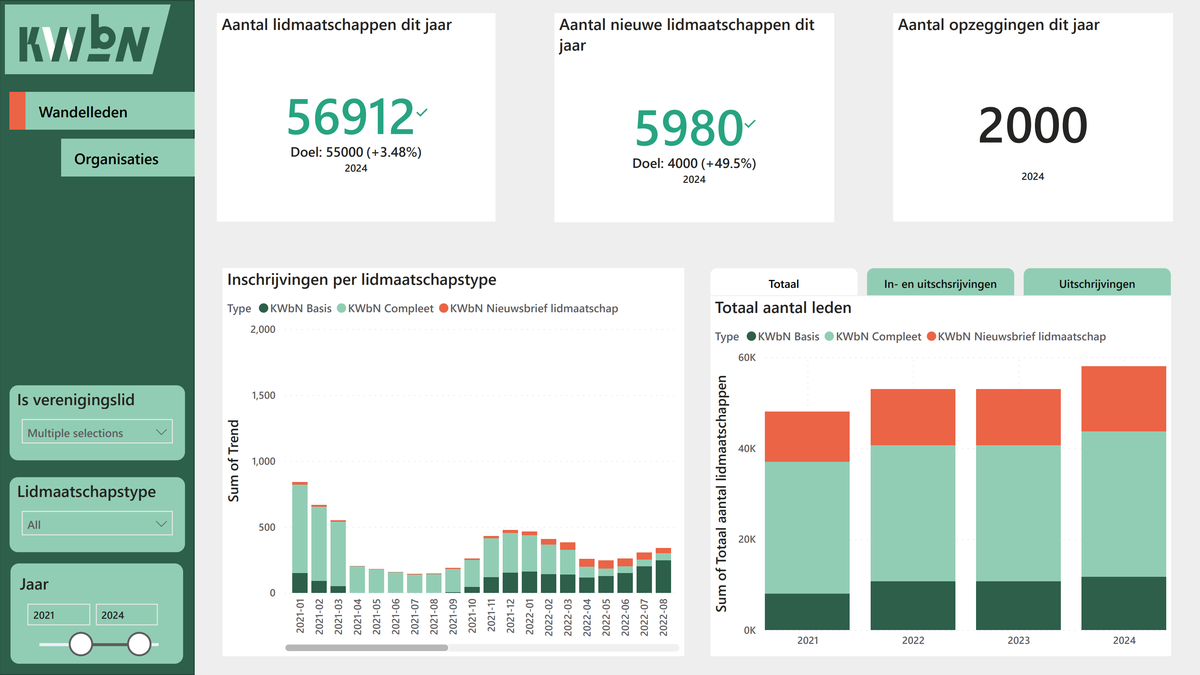
Our custom-made dashboards are tailored to the needs of the KWbN as a membership organisation. The dashboards provide real-time insights into federation office activities, membership statistics, marketing- and financial performance. This does not only improve the management choices but also clarifies the value of the KWbN to partners and stakeholders. A sample of the benefits of this dashboard:
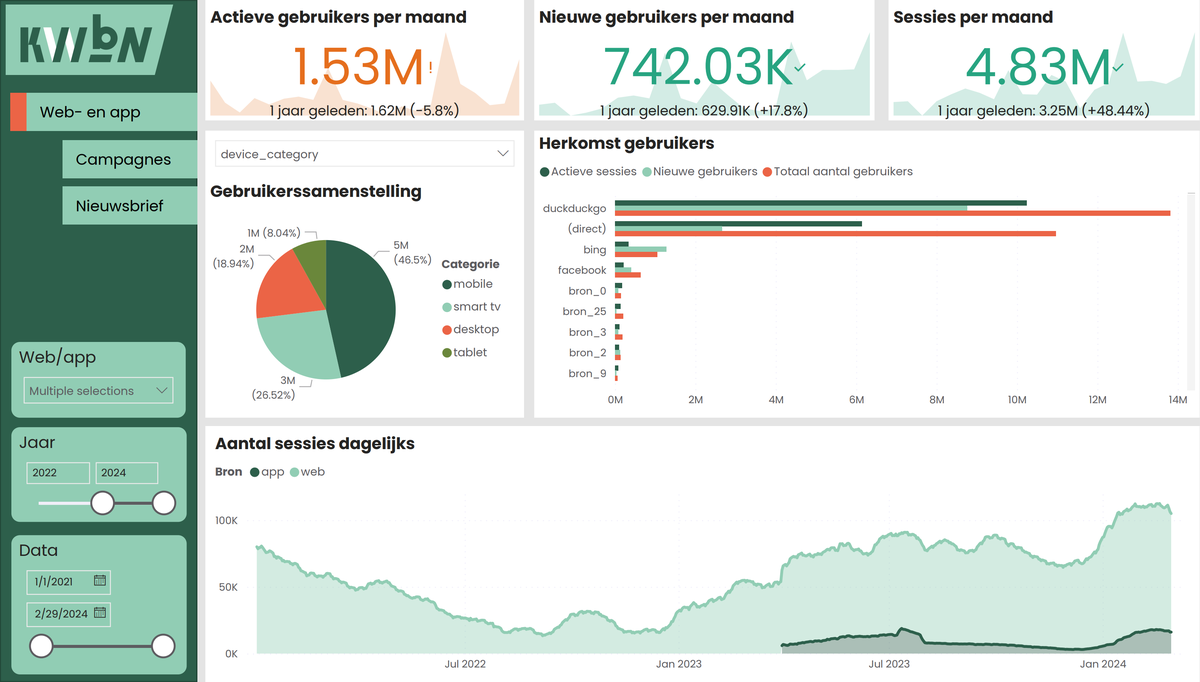
The developed dashboards are crucial for the decision-making process within the KWbN. With detailed information from systems like Google Analytics, ActiveCampaign, and their CRM, these dashboards provide a complete and up-to-date view of the organisation. These insights answer questions like: Which type of membership grows fastest? How do different types of mailings perform? In which periods are the most app and web traffic? Which products are most popular among non-members? These data-integrations enable the KWbN to take strategic decisions based on trustworthy analyses. This leads to optimisation of member acquisition, fine-tuning of marketing campaigns, and overall improvement of the operational efficiency.
The transformation of the KWbN to a data-driven organisation has led to considerable improvement to their operational efficiency and marketing performance. With these dashboards, the KWbN had the right tools to tune their offerings and their services to members. Additionally, the automation of the data-gathering process saves a lot of time, this easily saves them a day per week of boring manual work. This translates to a 5x ROI when only considering the saved hours in the first 3 years.
Now the organisation is well-prepared for the future with their modern, scalable data environment. Which helps them not just with improving the daily operations but also creates measurable impact on the business-results and the growth in memberships.
Integrated systems
Connected source-tables
Dashboards
Clear source-of-truth
In just 3 years
“Structurally showcasing data in the office helps everyone internalise it, which drives our goal- and result-driven orientation.”
-Gijs Janssen, CEO
“Data is now shown in one complete overview. Now we no longer need to go through different systems to gather it all. That saves us a lot of time!”
- Luuk van Bergen, Manager Service & IT
“This project proves that agile does work”
- Twan Willems, manager finance & control

CEO @ KWbN

Manager Service & IT @ KWBN

Manager Finance & Control @ KWbN
Would you like more information about this case, data warehouses, pipelines, or infrastructure?
Don't hesitate to contact Daan Luttik or Esmee Hermsen.

CTO
daanluttik@techonomy.nl
+31 (0)6 83 90 60 39

Digital Marketeer
esmeehermsen@techonomy.nl
+31 (0)6 20 888 265